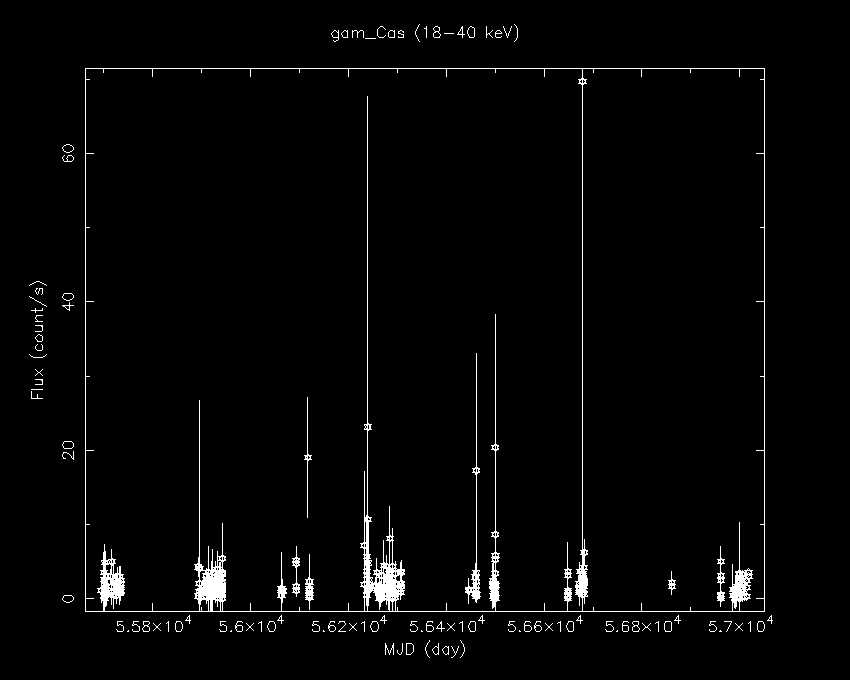
gam_Cas_isgri_lc_18-40.gif

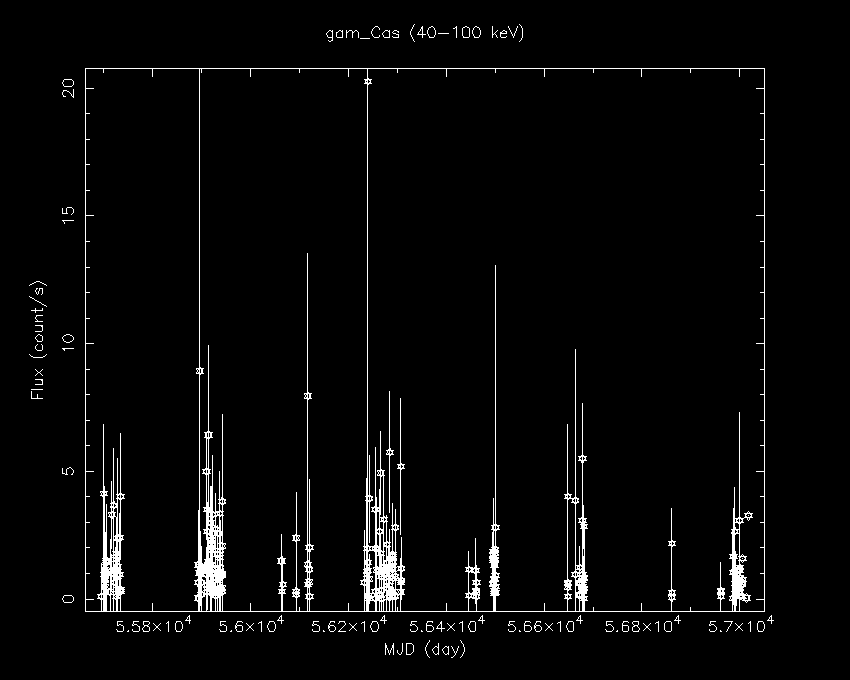
gam_Cas_isgri_lc_40-100.gif
INTEGRAL Galactic Plane Scanning Monitoring: gam_Cas
Light Curves
gam_Cas_isgri_lc_18-40.gif
gam_Cas_isgri_lc_40-100.gif
The above count-rates can be compared with calibration data taken of the Crab.
Points are marked at the centre of the science window with horizontal error bars showing its total length (about 1800 seconds). Sources within the field of view but not detected or with negative detection significance are plotted as flux = 0 with no vertical error bar. In the ScW ID column, a suffix of ".000" indicates that plots were compiled from NRT data; ".001" indicates CONS data.
Data for PlotsColumn format: MJD(days), +/-, Flux (counts/s), +/-, angle(isgri only), ScW ID
gam_Cas_isgri_lc_18-40.all
gam_Cas_isgri_lc_40-100.all
Go back to the INTEGRAL Galactic Plane Scanning home page